Lesson 3: Demand Planning Systems Architecture
Integrated Framework
It is the structure that connects processes, technologies, and data to forecast demand and align it with supply chain capabilities.
Technology-Driven
Combines demand forecasting tools, analytics platforms, and ERP systems for accurate planning.
Cross-Functional Alignment
Enables seamless collaboration between sales, marketing, production, and distribution teams.
Data-Driven Insights
Uses historical data, algorithms, and market intelligence to reduce uncertainty in demand.
Efficiency and Resilience
Improves resource allocation, ensures customer needs are met, and strengthens supply chain resilience.
Prepare & Load Data

Create Forecasting Units
Considerations when deciding at what level or in what detail to forecast:
- Customer Forecasting is only important if it helps to get the Forecast right at the Location level
- Don’t go into more granularity than you have to … it results in worse forecast accuracy and wastes time
- Consider where you can add the most value as a Demand Planner vs. letting the system work
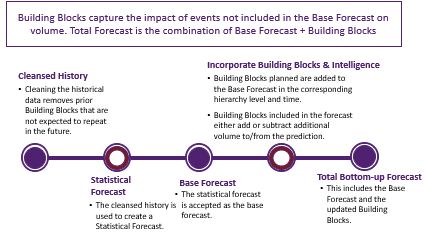
Develop Base Forecast
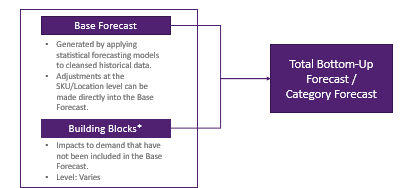
Calculate stat Forecast – Overview
- A statistical forecast is the best estimate of what will occur in the future based on history, model inputs, and model parameters
- This forecast serve as a starting point only, since no forecast is accurate
- The forecast can be adjusted based on history, experience, external/internal information, and knowledge of the current/future environment
Incorporate Events and Intelligence
Create Events – Key inputs into developing Events
- Volume – How many cases do we expect to ship? What is the anticipated lift? Are there past events we expect this event to mirror?
- Product Mix (Item) – What percentage of the total volume will be represented by each item in the promoted group?
- Timing (Week) – How will the shipments pace across the weeks? What percent will be shipped before a promotional week and what percent will ship during and after the promotional week?
- Mondelēz Ship From (Location) – How much will be shipped from each Mondelēz location? Factors in determining the location are the customer percentages as well as the volume anticipated to ship direct from plants/buffers
Consensus
AVM – High Level cross-functional roles
Sales Planning
–Key Customer/Channel calls
–Merchandise Calendars with regular updates
–Trade Planning Information on Key Customers
–Customer Planning worksheets
–Customer New Product Acceptance / Customer de-authorizations
Finance
–Annual Contract plans with assumptions
–Latest financial plan (Monthly Business update/LE)
–Financial targets
–Revenue conversion mix issues
–Pricing changes that impact revenue in future
Demand Planner Forecasting
- Prepare Consensus packet including report and prior month accuracy
- Prepare Bottom-Up Customer Events
- Review Recent Trends that show change in expected pattern
- Statistical Spikes and Outliers
- Identification of families with accuracy issues
- Identify significant differences between bottom-up forecast and previously aligned to Consensus call
- Identify high bias or low bias categories
Finalise Forecast and Release to Supply Planning
Understanding Disaggregation
- Working at the most granular level is not generally worth the time and may lead to poor results
- Understanding how a Forecast is disaggregated on 4 dimensions is important to understand
–Product Dimension (from Category down to Item)
–Customer Dimension (from national volume to customer specific)
–Shipping Location (from national to ship from source)
–Time Dimension (from months to weeks)
- Forecasts are generally disaggregated by weighted average considering history or existing forecast at more detailed level
- Disaggregation can have a HUGE impact on accuracy
Manage Forecast Performance
Demand Planning KPIs
- Three critical KPIs – Forecast Error, Forecast Bias and Forecast Bias Ratio
- At PPG (Brand) level
- Usage:
- –Forecast Error (%): Inaccuracy at SKU level
- –Forecast Bias (%) (positive, negative, no bias): Behavioural measure (tendency to over-plan/under-plan) expressed in %
- –Forecast Ratio (+/-): Count of + / – Forecast Bias within current year
Root cause analysis:
- –Which building blocks are causing the bias/error?
- –Which assumptions are wrong?
- Data quality drives everything – bad history = bad forecast.
- Base forecasts are a starting point – business intelligence refines them.
- Events matter – promotions, launches, and trade activities are major demand drivers.
- Collaboration ensures alignment – assumptions must be debated and agreed upon.
- Operational link is crucial – forecasts must feed into supply, production, and fulfilment.
- Continuous evaluation makes it stronger – tracking bias and errors prevents repeat mistakes.
Step 1: Prepare Data
Importance:
- Ensures the foundation is solid. Clean and accurate data prevents misleading trends and wrong forecasts.
- Segmentation and lifecycle classification help planners focus on critical products instead of wasting time on low-impact items.
- By scrubbing history, planners avoid overproducing or underproducing due to one-off events (like promotions or stockouts).
- 👉 Without this step, forecasts would be built on “dirty data,” leading to major accuracy issues and inefficiencies down the line.
Step 2: Create Base Forecast
Importance:
- Provides an unbiased, statistically driven starting point before human judgement adds adjustments.
- Identifies realistic trends and patterns in demand based on cleansed history.
- Establishes a transparent foundation for discussions across teams
- 👉 This step balances science with judgment — without it, forecasts could be purely opinion-driven, leading to bias.
Step 3: Incorporate Events
Importance:
- Captures the impact of promotions, pricing changes, marketing campaigns, or product launches that raw statistics can’t account for.
- Reduces costly errors by aligning with sales and marketing intelligence.
- Helps anticipate demand spikes or dips tied to planned activities.
- 👉 Without incorporating events, forecasts ignore real-world market activities — resulting in inaccurate supply and revenue plans.
Step 4: Conduct Collaboration
Importance:
- Ensures all functions (sales, finance, supply chain, marketing) agree on one plan instead of working with conflicting numbers.
- Builds trust and accountability by debating assumptions openly.
- Highlights gaps between plans and actual business targets, driving corrective actions.
- 👉 This is where forecasting shifts from being “a number” to “a business decision.”
Step 5: Finalise Forecast
Importance:
- Translates the consensus forecast into a clear, actionable operational plan.
- Feeds supply, production, and fulfilment systems to ensure execution matches strategy.
- Manages short-term changes and abnormal demand through demand control, protecting supply chain stability.
- 👉 This step turns plans into reality — without it, forecasts remain theoretical and disconnected from operations.
Step 6: Evaluate Forecast Performance
Importance:
- Provides visibility into how accurate forecasts were and where errors came from.
- Tracks bias to prevent consistent over- or under-forecasting.
- Supports continuous improvement by identifying root causes and implementing corrective actions.
- 👉 This step closes the loop — without evaluation, mistakes repeat, and the process never improves.
- Step 1 builds the foundation (data quality).
- Step 2 creates an unbiased base.
- Step 3 integrates market realities.
- Step 4 aligns stakeholders.
- Step 5 connects to operations.
- Step 6 drives learning and improvement.